Process Book
Overview and Motivation
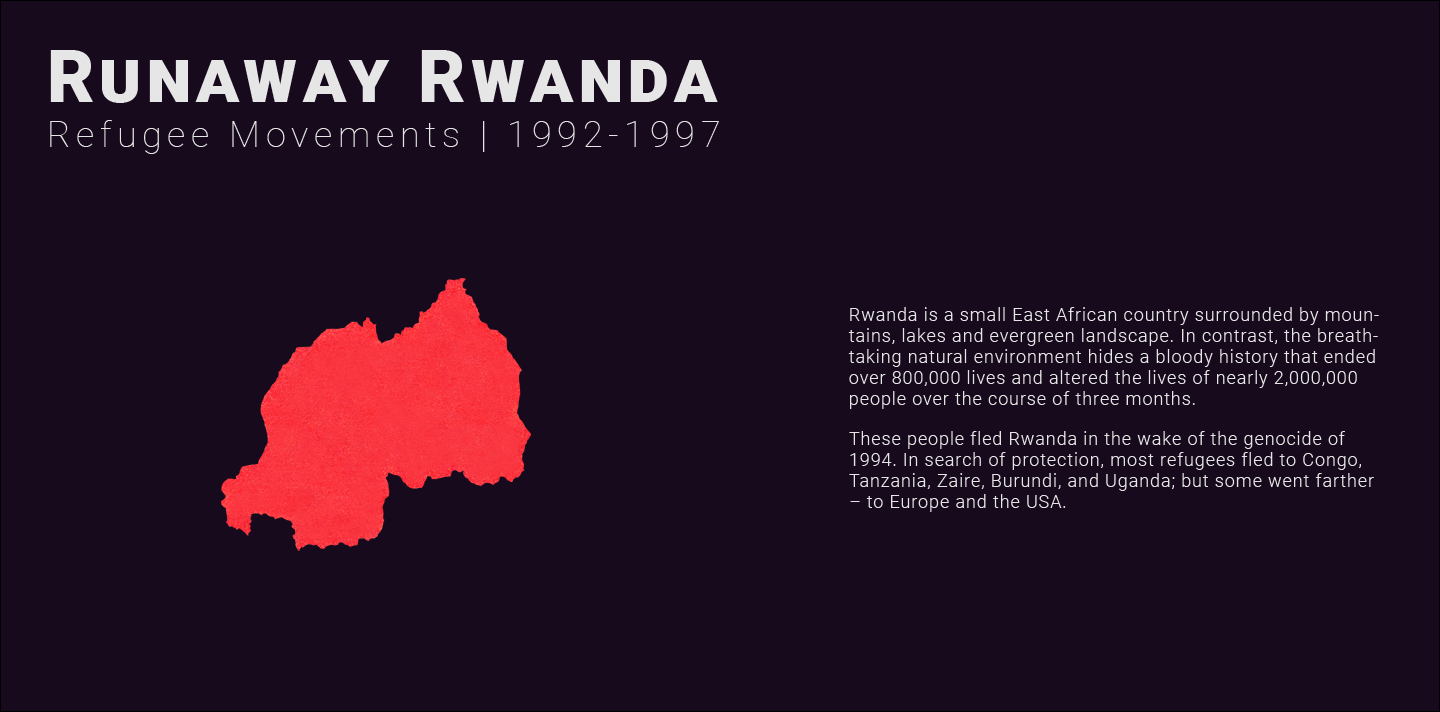
Rwanda is a small East African country surrounded by mountains, lakes and evergreen landscape. In contrast, the breathtaking natural environment hides a bloody history that ended over 800,000 lives and altered the lives of over 1,000,000 people in only 100 days (BBC, 2019; The UN Refugee Agency).
Mission and Goals
The goal of this project is to inform the global community about the horror of genocide and its consequences in Rwanda through survivors’ voices. Using an interactive/animated map and timeline, we will plot the migration flow of people from Rwanda to different countries and back, from 1992 to 1997. We will trace the pre-genocide history, the period of genocide, and the post-genocide reconstruction processes. The quantitative data will be supported with narrative information about political situation, events, and victims’ accounts.
Tasks
- Data Collection & Analysis (qualitative & quantitative)
- Assembling Data into a Story (narrative content, story flow)
- Graphic & Interactivity Design (style guide, sketches, wireframes)
- Website Design Implementation (HTML/CSS, JavaScript, D3)
Logistics
Project Plan
The project will consist of three parts:
- Introduction
- Rwandan Catastrophe
- Pre-Genocide History (1992-1993)
What was the political situation? What were the reasons of migration that time? Is that migration flow normal? What were the forerunners of the genocide?
- Genocide History (1994)
Why did it happen? What was the political situation? Was violence in refugees in the Congo camps (and perhaps others) became the reason why refugees returned to Rwanda?
- Post-Genocide History (1995-1997)
What were the reconstruction programs/processes? Is the quick re-entry of refugees after the 1994 crisis normal?
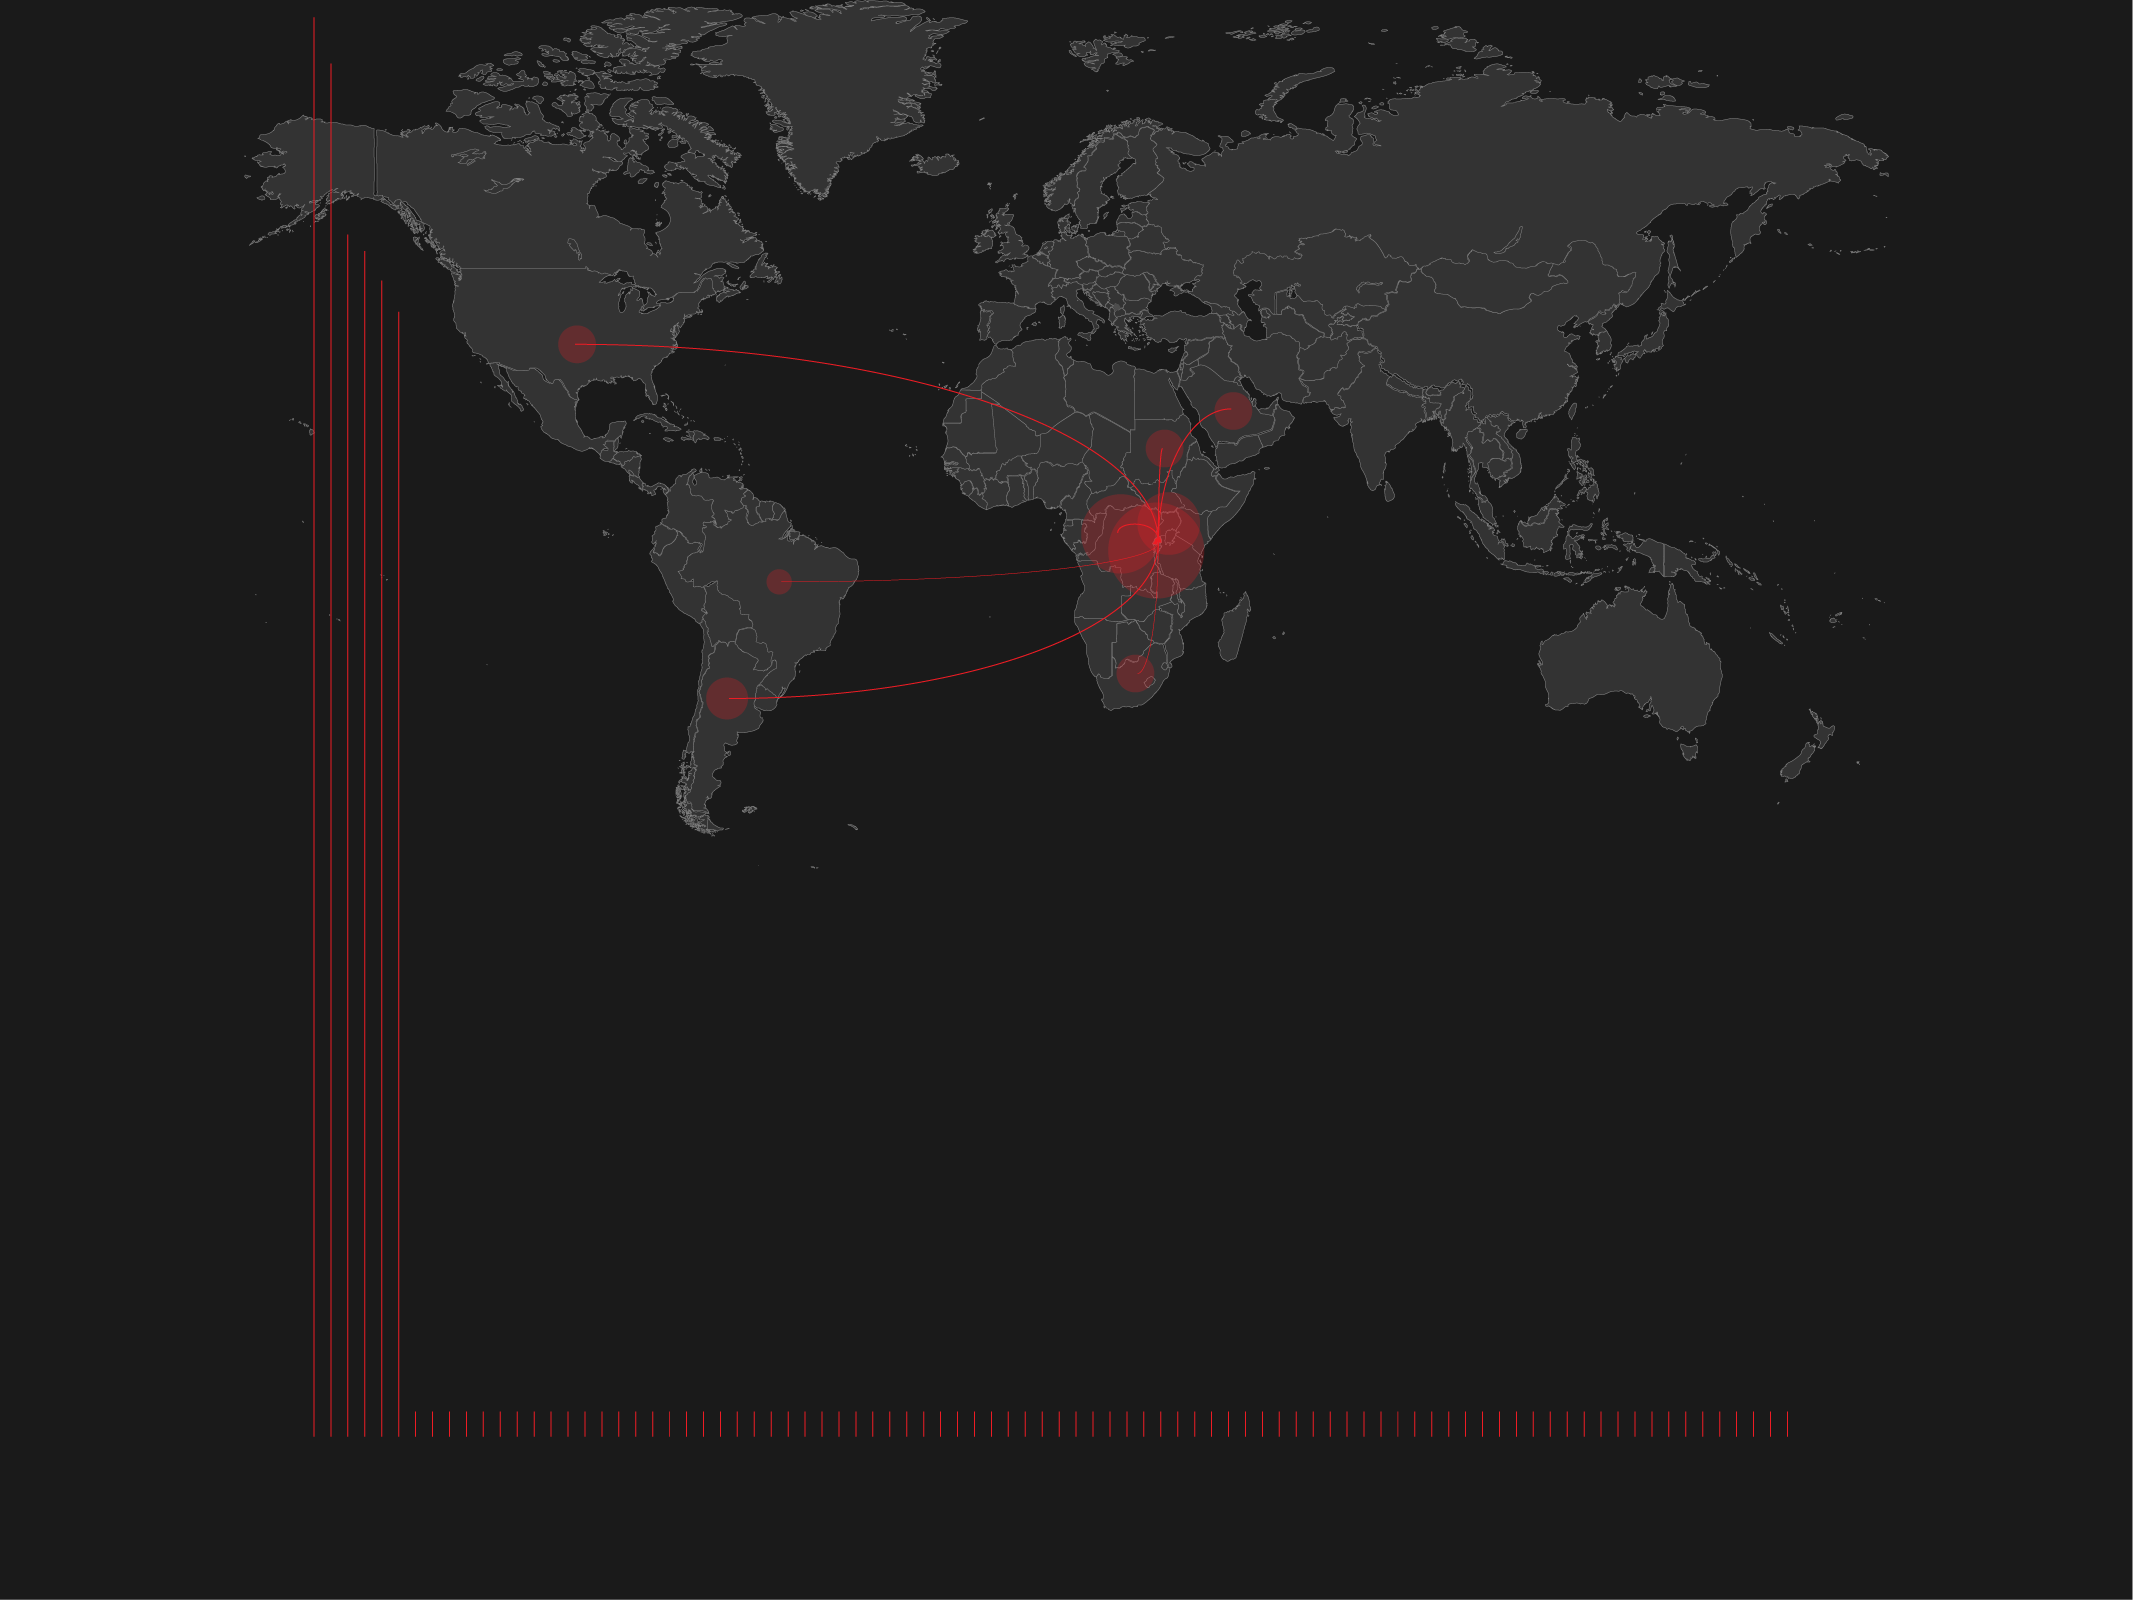
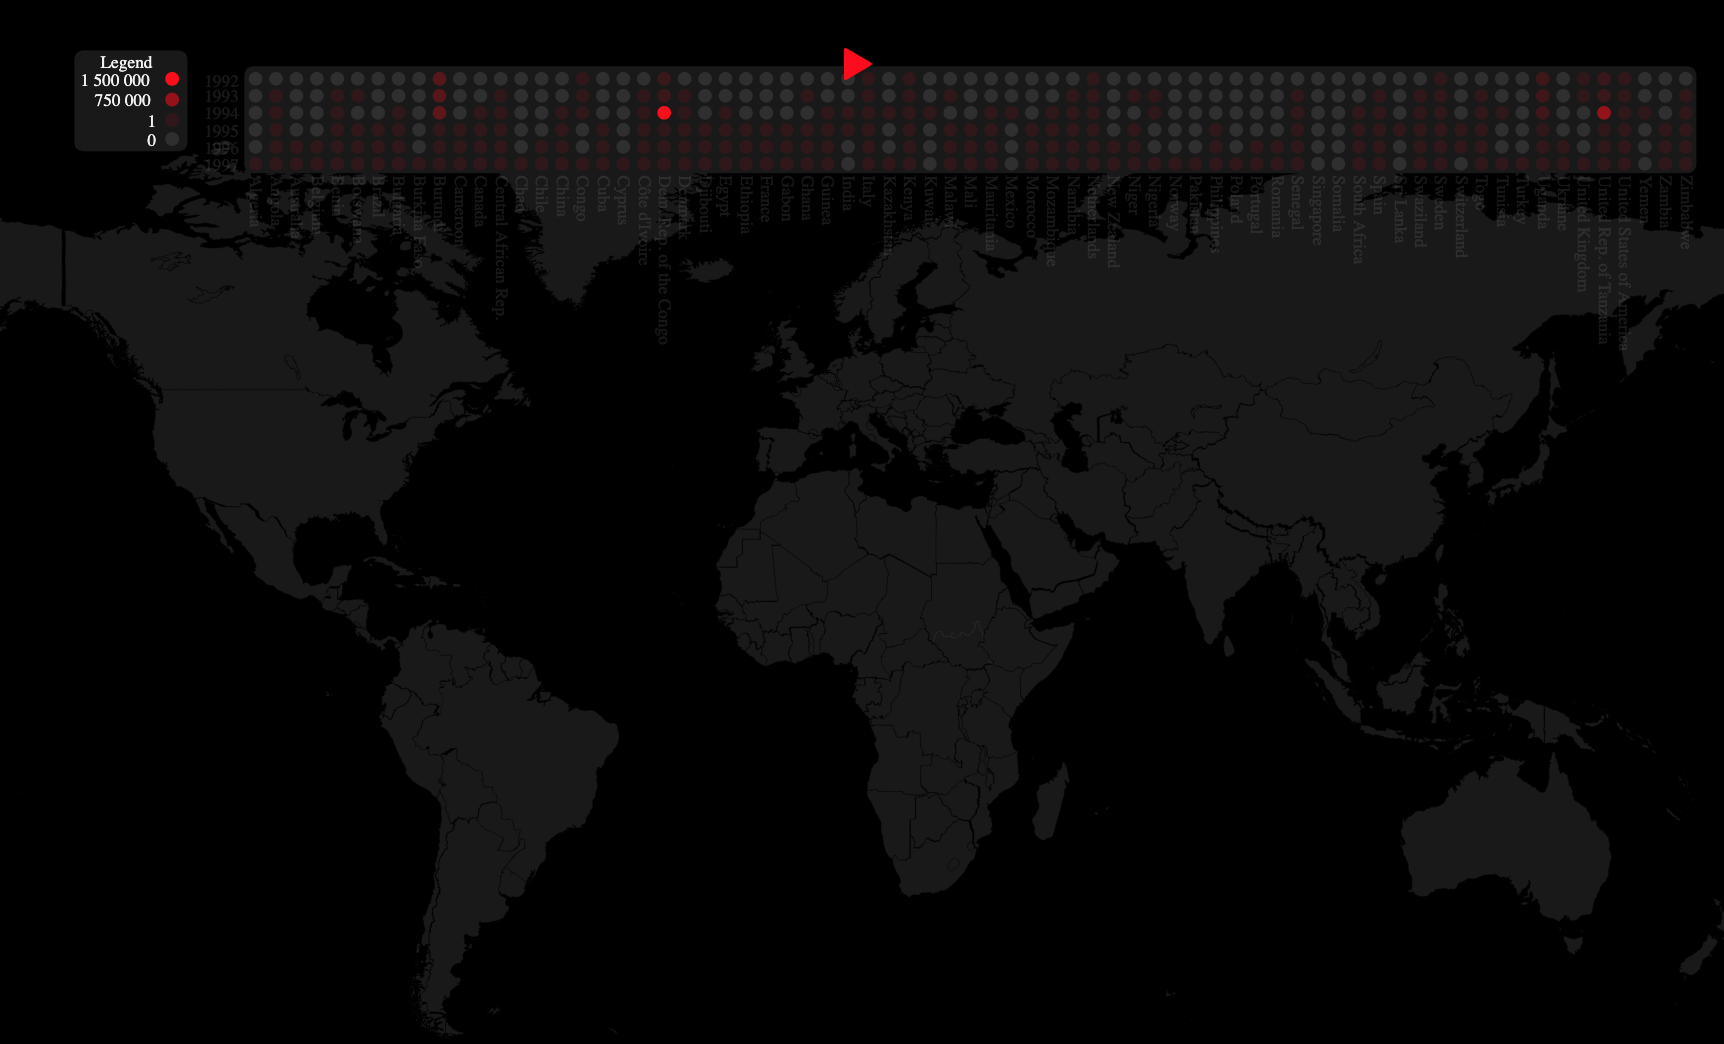
- Interactive/Animated World Map
- Automatically traces the flow of people migrating from Rwanda to different countries and back (brushed up by year). Ex.: https://www.fireeye.com/cyber-map/threat-map.html
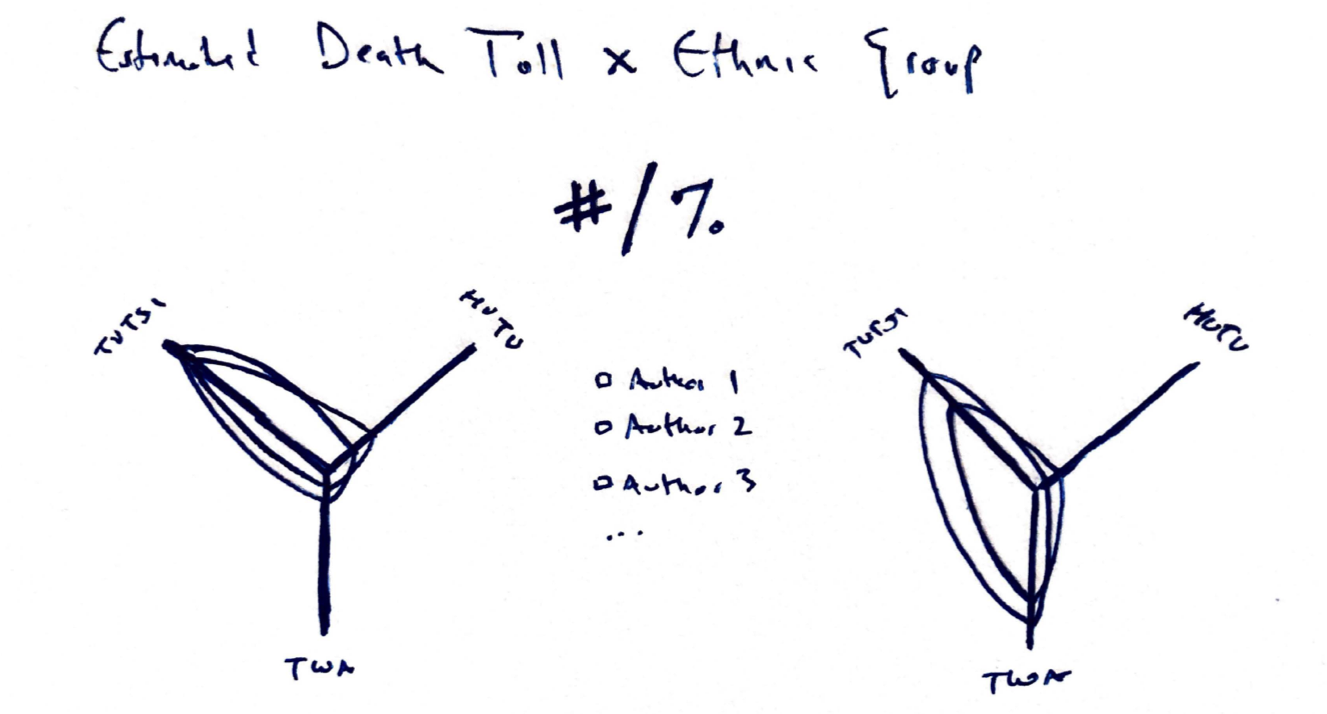
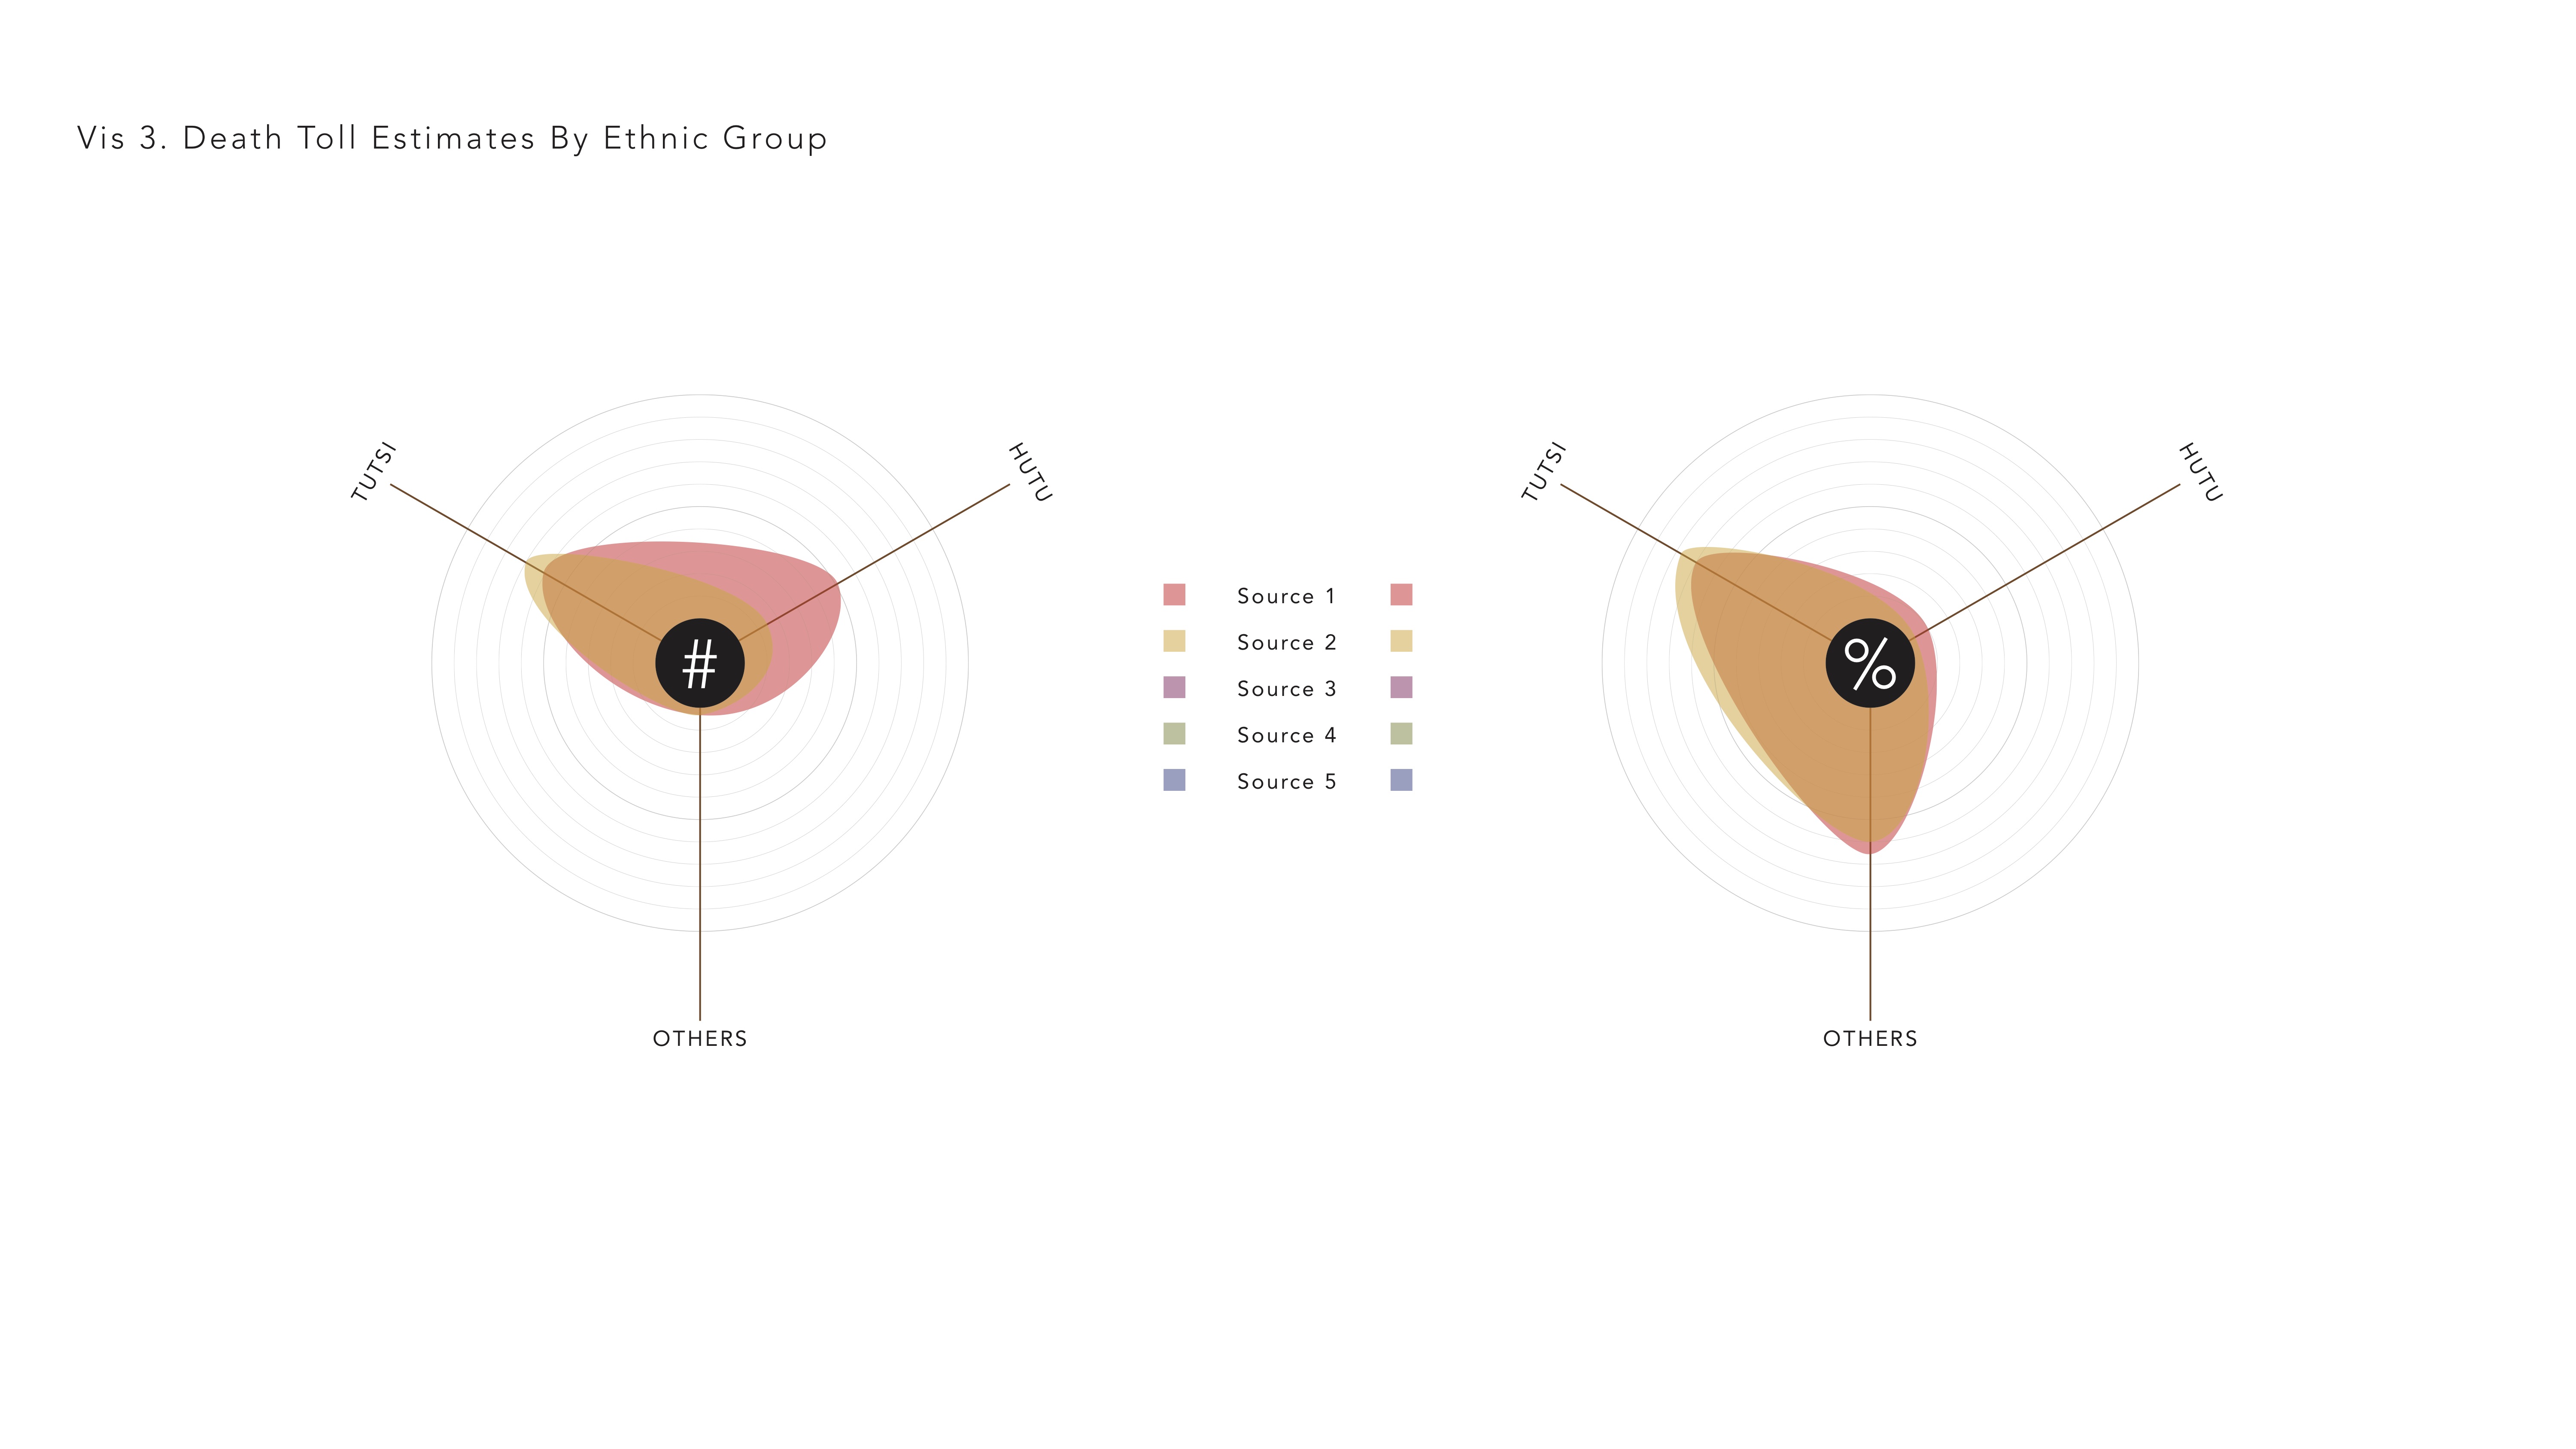
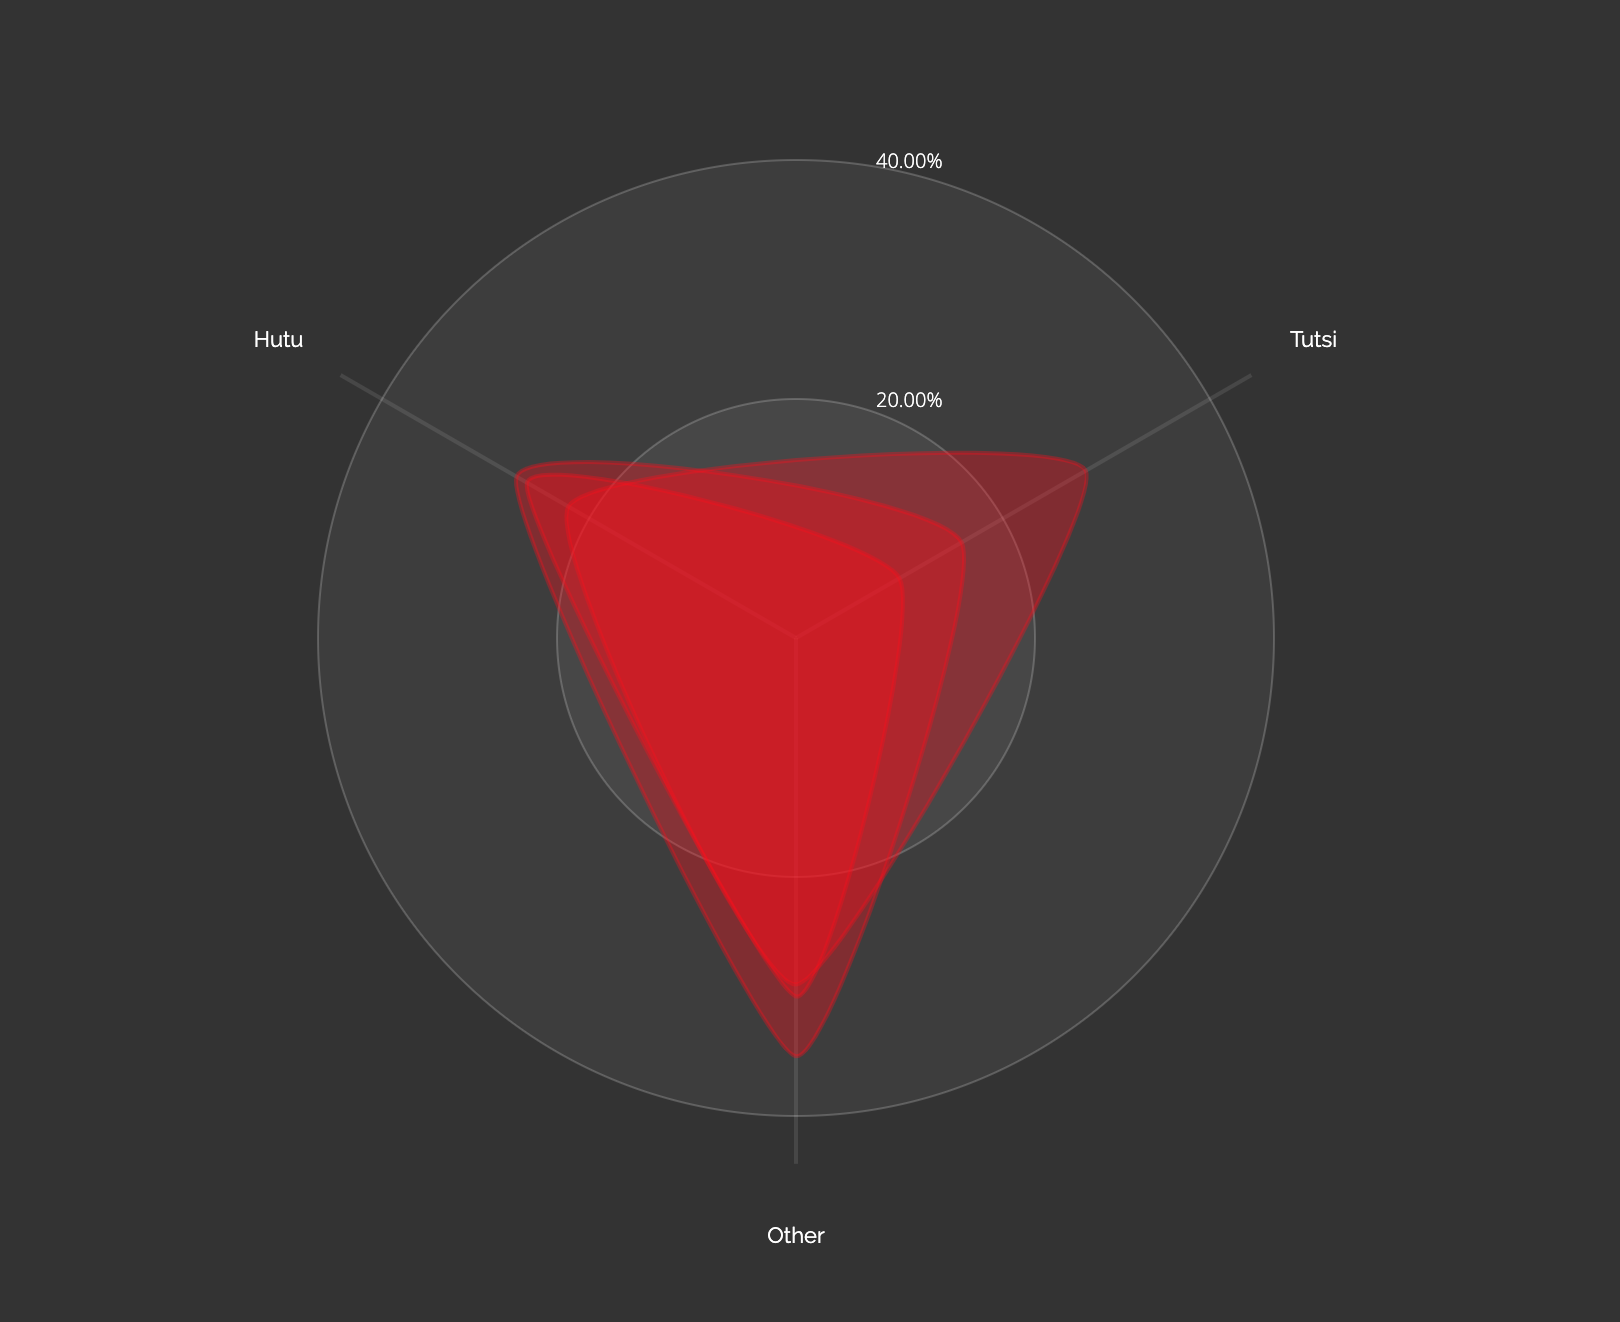
- Death Estimates by Ethnic Groups.
- While the massacre happened 25 years ago, the exact number of people killed is still unknown. Up until now the mass graves and individual skeletons are being found. Different sources provide different numbers. Two Hive-Visual diagrams will combine data from 4+ sources and present the number & percent of Tutsi, Hutu, Other ethnic groups being killed.
Timeline
- 27 April – Concept presentations
- 28 April – Process book draft
- 4 May – Finalize data research and analysis
- 5 May – Project wireframes and updated process books due
- 14 May – Project Deadline
- 16 May – Project presentations and screencasts
Team Roles
- Christopher Thompson
- Data research & analysis, sketching, visualization design, site development (HTML, CSS, JS, D3)
- Allie Marbry
- Project management, typography, colors, and style design, textual content, content editing, screencast script and narration, site development (HTML/CSS)
- Jared Jessup
- Data research & analysis, sketching, visualization design, and site development (HTML, CSS, JS, D3)
- Anastassiya Yudintseva
- Data research & analysis, narrative, timeline, process book, screencast, textual content, project management.
Design Evolution
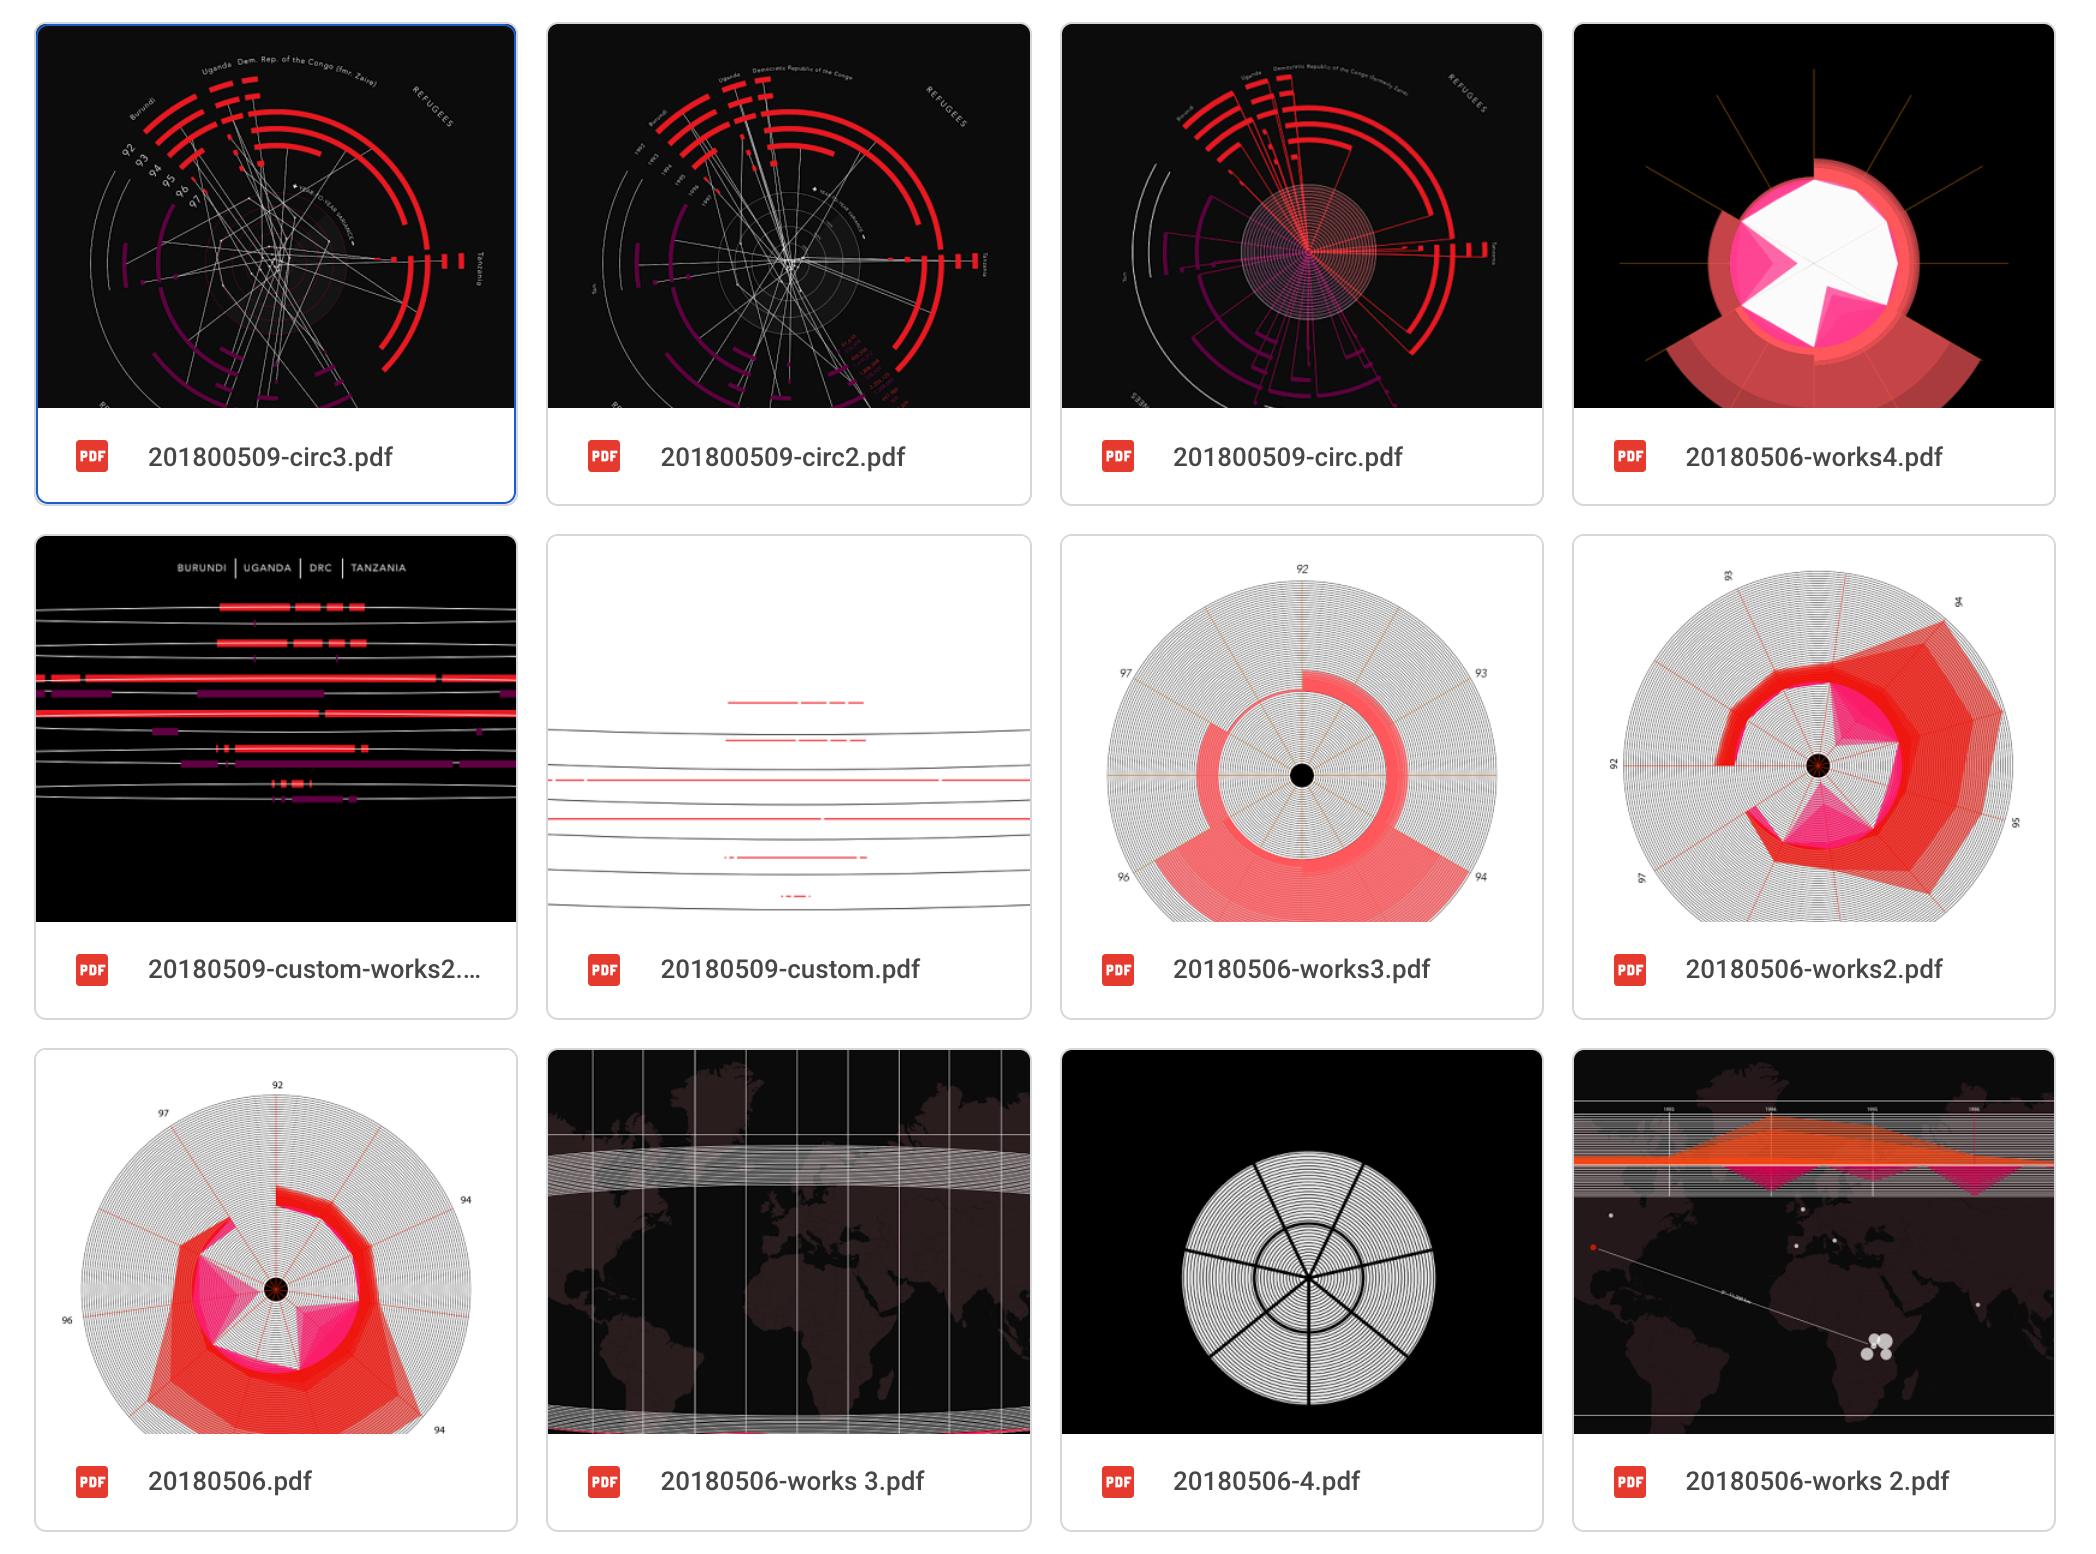
Sketches
Wireframe